
TL;DR:
- Shipping container market projections for 2026 vary from $10.9 billion to $18.38 billion, creating strategic uncertainty.
- Demand is driven by global trade recovery, e-commerce growth, and specialized container needs like reefers.
- Supply challenges include port congestion, empty repositioning, and technological shifts toward IoT-enabled containers.
Two analysts look at the same industry and arrive at projections that differ by nearly $8 billion. That is the reality of shipping container market forecasting heading into 2026, and it creates a real problem for businesses trying to make smart procurement and investment decisions. The market size projections for 2026 vary widely, which means relying on a single headline number is a fast track to a flawed strategy. This guide cuts through the noise by breaking down the core growth drivers, supply shifts, persistent challenges, and practical opportunities that actually matter for shipping and construction businesses right now.
Table of Contents
- Sizing up the 2026 shipping container market
- Demand forces: What's propelling the market
- Shifts in supply: Technology, region, and sustainability
- Challenges & opportunities: Empty repositioning, congestion, and secondary markets
- Why market averages can mislead your shipping container strategy
- Ready to optimize your container strategy?
- Frequently asked questions
Key Takeaways
| Point | Details |
|---|---|
| Forecasts diverge | 2026 market projections differ widely, so plan for agility rather than certainty. |
| Specialized demand surges | Reefer and high-cube container demand is rising, creating new investment opportunities. |
| Asia-Pacific dominates | Focus supply strategies on Asia-Pacific’s robust manufacturing base for competitive advantage. |
| Tech and sustainability | Adopt smart and sustainable containers as both trends reshape cost structures and compliance. |
| Repurposing pays | Secondary markets in construction and storage can add value beyond traditional shipping. |
Sizing up the 2026 shipping container market
If you have tried to benchmark the global shipping container market lately, you have probably noticed that the numbers do not line up. That is not a data error. It reflects genuine differences in methodology, data sources, and how analysts account for post-pandemic market shocks.
The spread is significant. 2026 global market projections range from $10.9 billion to $18.38 billion, depending on the report you consult. Long-term growth forecasts are equally scattered, with CAGR estimates diverging from 4.78% to 12.5% through the end of the decade.
| Source type | 2026 market estimate | CAGR projection |
|---|---|---|
| Conservative models | ~$10.9 billion | ~4.78% |
| Moderate models | ~$14 billion | ~7.5% |
| Optimistic models | ~$18.38 billion | ~12.5% |
For businesses evaluating container investments, this spread matters more than the specific number. A company sizing up a fleet purchase based on the optimistic projection could overpay if the conservative scenario plays out. The reverse is equally risky: underinvesting when demand spikes.
The smart move is to anchor your strategy around the midpoint while building in flexibility. Container pricing tends to track demand cycles, so businesses that lock in purchases during softer demand windows typically come out ahead regardless of which forecast proves accurate.
Pro Tip: Rather than waiting for a single authoritative forecast, track container spot pricing on a monthly basis. Price movement is a more reliable real-time signal than any annual projection.
Demand forces: What's propelling the market
Understanding why the market is growing is more useful than knowing exactly how large it will get. Several forces are converging in 2026 to push container demand higher across multiple sectors.
Global trade normalization after years of disruption is the biggest factor. Containerization now accounts for 80% of all seaborne trade, and as trade volumes recover and stabilize, demand for standard containers remains structurally strong. E-commerce growth compounds this effect, pushing retailers and logistics providers to maintain larger container inventories closer to end consumers.
Beyond standard dry containers, specialized units are seeing accelerated demand. Reefer containers (refrigerated units used for food and pharmaceuticals) are growing faster than the overall market, driven by cold chain expansion and stricter pharmaceutical shipping regulations. If you are not familiar with the full range of container types, brushing up on shipping container terminology will help you match the right unit to the right application.
Here are the primary demand drivers worth tracking:
- Global trade recovery: Normalized shipping lanes and restored trade agreements are rebuilding volume.
- E-commerce fulfillment: Last-mile logistics networks require more containers staged at regional distribution points.
- Supply chain resilience: Businesses are holding larger buffer stock, which increases container utilization.
- Cold chain and pharma growth: Reefer demand is outpacing standard dry container growth.
- Construction and storage repurposing: Secondary markets are absorbing retired shipping containers at a faster rate.
"The shift toward supply chain resilience is not a trend. It is a structural change. Businesses that treat container access as a strategic asset rather than a transactional cost will be better positioned for disruption."
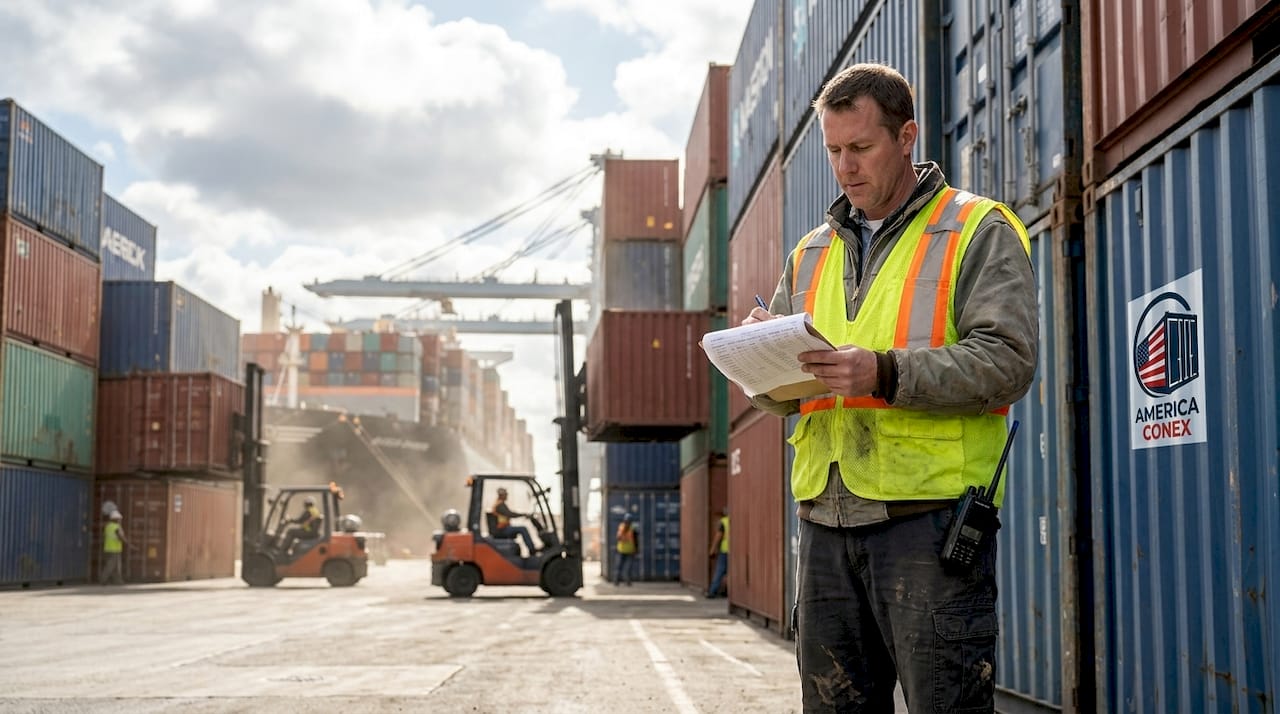
For construction companies specifically, the repurposing trend is opening real opportunities. Containers are being used as on-site storage, modular offices, and temporary facilities at a rate that is visibly accelerating.
Shifts in supply: Technology, region, and sustainability
Demand is only half the equation. What is happening on the supply side is equally important for businesses making sourcing decisions in 2026.
Geographically, the supply picture is concentrated. Asia-Pacific holds 41% market share, with China remaining the dominant manufacturing force. This concentration creates both efficiency and risk. When Chinese manufacturing output slows due to regulatory changes or labor disruptions, global container supply tightens quickly. Businesses sourcing domestically or through diversified channels have a meaningful buffer against these shocks.
Technology is reshaping the container itself. 30% of new containers now feature IoT technology, including GPS tracking, temperature monitoring, and condition sensors. This is a meaningful shift for logistics operators who need real-time visibility across their fleets.
| Feature | Smart (IoT) containers | Traditional containers |
|---|---|---|
| Tracking | Real-time GPS | Manual check-in |
| Condition monitoring | Automated alerts | Visual inspection |
| Upfront cost | Higher | Lower |
| Best use case | High-value or temp-sensitive cargo | General storage and shipping |
Sustainability is also becoming a cost factor, not just a marketing talking point. EU emissions trading policies are increasing operational costs for shipping lines, which eventually flows downstream to container pricing and logistics budgets. Recyclable materials and lower-carbon manufacturing processes are gaining traction as buyers factor lifecycle costs into procurement decisions.
Pro Tip: If you are evaluating container purchases for long-term use, factor in maintenance and resale value alongside the purchase price. Strategies for cutting container costs can significantly affect your total cost of ownership over a multi-year horizon.
Challenges & opportunities: Empty repositioning, congestion, and secondary markets
Growth projections do not tell you about the friction inside the market. Two persistent problems are eating into container ROI across the industry, but they also point toward real opportunities for businesses willing to look at them differently.
The first problem is empty repositioning. 40% of containers move empty, representing a massive inefficiency that inflates costs for everyone in the chain. Port congestion makes this worse, adding roughly 30% inefficiency to logistics operations at major hubs. These are not new problems, but they are intensifying as trade volumes grow faster than port infrastructure.
"Empty moves and port delays are not just operational headaches. They are margin killers. Businesses that build routing flexibility into their logistics plans absorb these shocks better than those locked into rigid schedules."
The second major challenge is congestion at key ports, which creates cascading delays that affect delivery timelines and inventory planning. For construction companies relying on containers as job site storage, an unexpected delay can stall an entire project.
Here is how forward-thinking businesses are turning these challenges into opportunities:
- Buy rather than rent during soft markets. When repositioning costs drive down used container prices, purchasing rather than leasing locks in lower per-unit costs.
- Repurpose retired containers. Rising demand from construction and storage conversions creates a strong secondary market for containers that are no longer cargo-worthy but still structurally sound.
- Stage containers regionally. Placing containers closer to job sites or distribution points reduces exposure to port delays.
- Audit your workflow. Identifying where container moves are redundant can directly reduce empty repositioning costs. Resources on solving workflow inefficiencies can help you map those gaps.
- Evaluate secure storage solutions for dual-use applications. Containers that serve both shipping and on-site storage functions generate more value per unit.
Why market averages can mislead your shipping container strategy
Here is the uncomfortable truth about market forecasts: the businesses that chase headline growth numbers often make worse decisions than those that ignore them entirely. A 7% CAGR for the global container market tells you almost nothing about whether buying 20-foot used containers in the Southeast United States is a good move for your construction business right now.
Contrasting market forecasts from leading research firms reinforce this point. When top analysts disagree by billions of dollars, the signal is not that one is right and the others are wrong. The signal is that the market is segmented, and different segments behave very differently.
Reefer containers are growing faster than dry containers. APAC supply dynamics do not mirror North American demand patterns. Construction sector repurposing is growing independently of global trade volumes. These are the plays that actually move the needle for operators.
The businesses we see making the sharpest moves are not the ones with the best market reports. They are the ones asking better questions: What container type fits my specific use case? Should I rent vs. buy given my project timeline? What does regional pricing look like right now? Exploring container purchase options with those specific questions in hand produces far better outcomes than anchoring to a global average.
Average growth rates are a starting point, not a strategy. Segment your thinking, and the market becomes a lot clearer.
Ready to optimize your container strategy?
The 2026 shipping container market rewards businesses that move with precision, not just speed. Whether you are expanding a logistics fleet, sourcing job site storage, or repurposing containers for secondary applications, the trends covered here point to one clear takeaway: informed buyers get better deals.
At America Conex, we supply new and used shipping containers for sale across the United States, with 30+ depot locations ensuring fast delivery and competitive pricing wherever you operate. From wind and water tight units to one-trip containers in like-new condition, we match the right container to your specific need. Explore our full shipping container guide to sharpen your buying decision, or reach out directly to get current pricing and availability in your region.
Frequently asked questions
What is the forecasted size of the global shipping container market in 2026?
Projections for 2026 range from $10.9 billion to $18.38 billion, reflecting strong but varying expectations depending on the analytical model used.
Which region leads shipping container production?
Asia-Pacific holds 41% global share, with China at the forefront of manufacturing output, making it the dominant force in global container supply.
What trends are driving specialized shipping container demand in 2026?
Rising cold chain logistics, pharmaceutical shipping requirements, and e-commerce growth are boosting demand for specialized units like reefers, with reefer demand up 15% year over year.
How do sustainability trends impact container logistics in 2026?
30% adoption of IoT containers is improving fleet visibility, while EU sustainability regulations are pushing up operational costs for shipping lines and influencing procurement decisions across the industry.